Importing Cube Data to Power BI
To connect Power BI Desktop to a REST API that requires a JSON payload in a POST request, follow these steps:
1. Open Power Query Editor in Power BI Desktop and navigate to the Home tab.
2. Click on Transform Data to open the Power Query Editor.
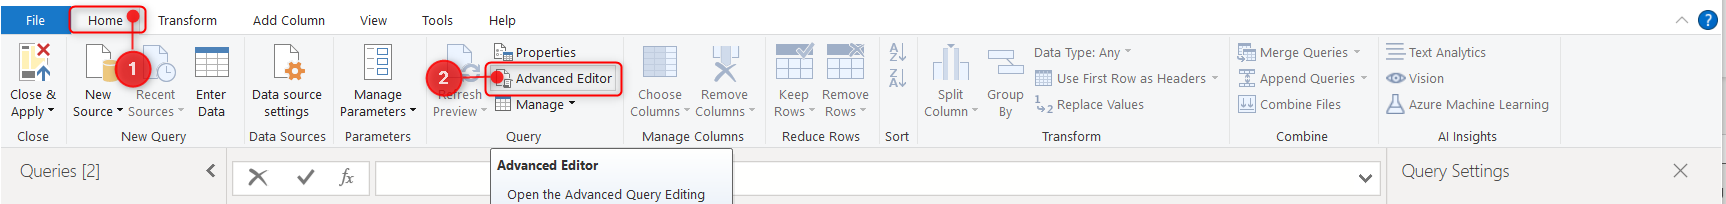
3. In the Power Query Editor, go to the Home tab.
4. Click on New Source and select Blank Query.

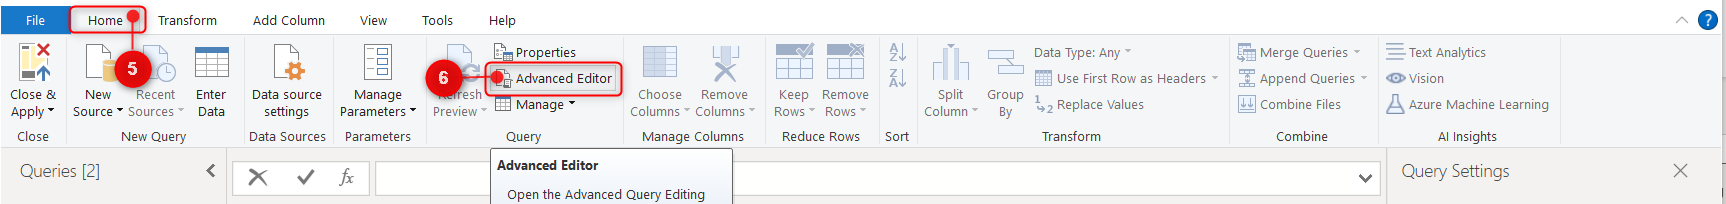
5. With the new blank query selected, go to the Home tab.
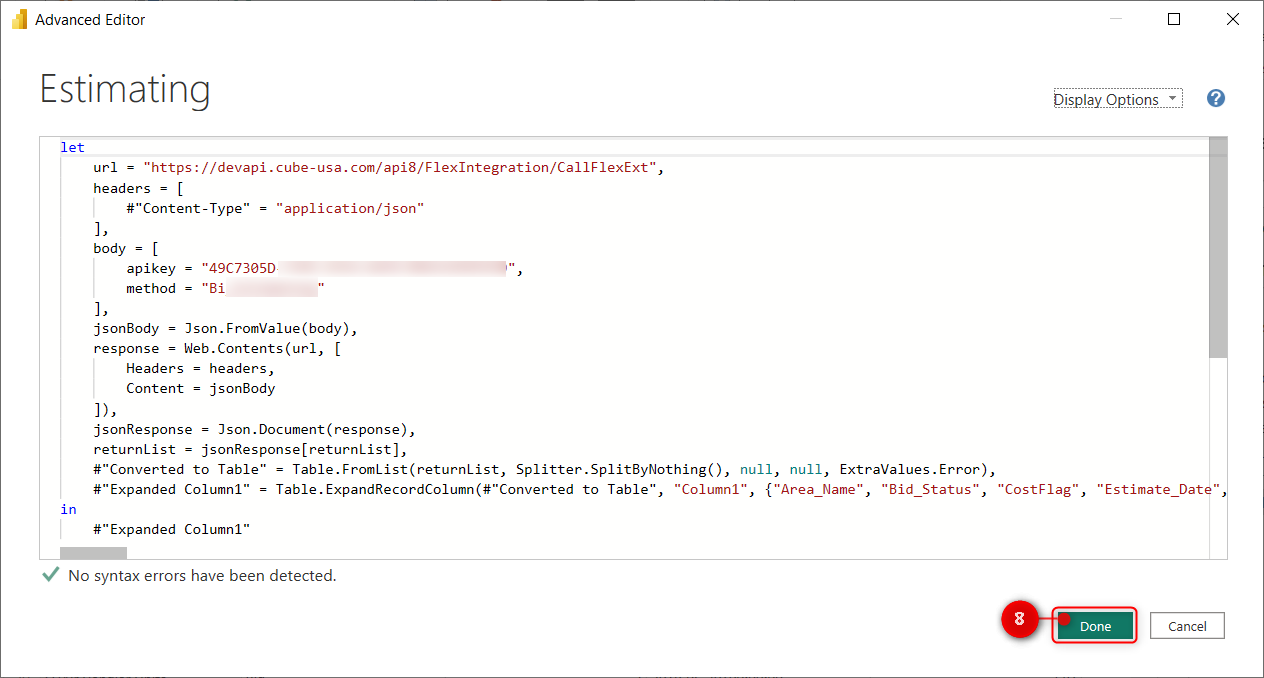
6. Click on Advanced Editor.
7. In the Advanced Editor, input the following M code, adjusting the url, headers, and body variables as needed:
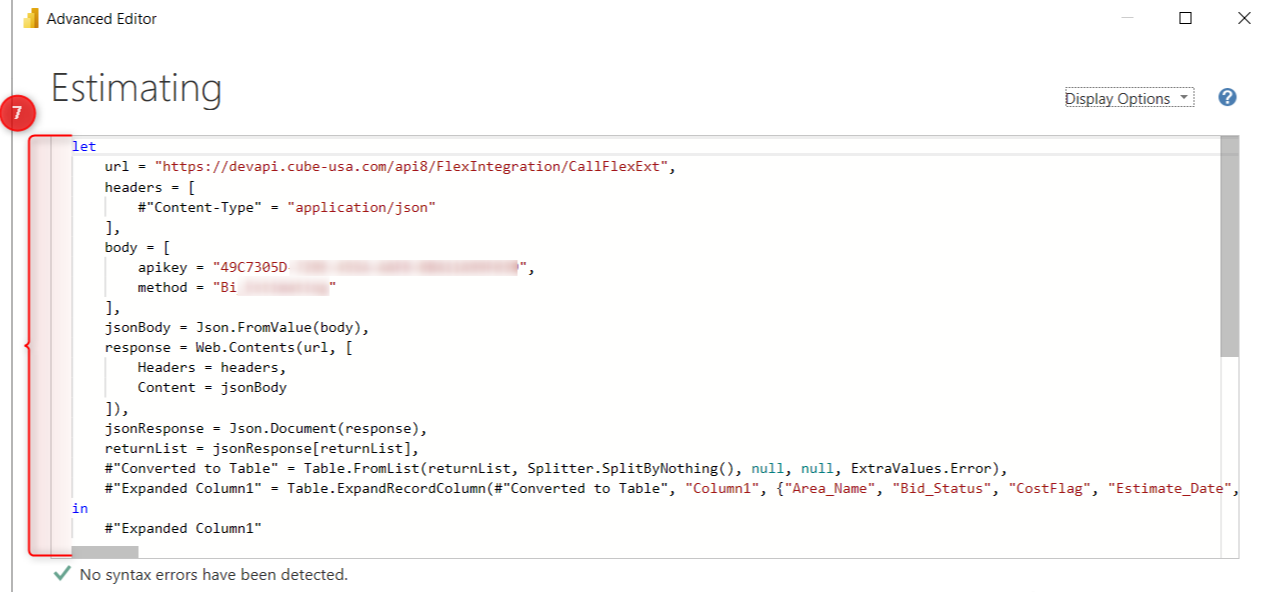
let
url = "https://devapi.cube-usa.com/api8/FlexIntegration/CallFlexExt",
headers = [
#"Content-Type" = "application/json"
],
body = [
apikey = "DD740686",
method = "Bi"
],
jsonBody = Json.FromValue(body),
response = Web.Contents(url, [
Headers = headers,
Content = jsonBody
]),
jsonResponse = Json.Document(response)
in
jsonResponse
Explanation:
1. url: The API endpoint you're targeting.
2. headers: A record containing necessary HTTP headers. Ensure you include the correct Content-Type and any required authorization tokens.
3. body: A record representing the JSON payload to be sent in the POST request.
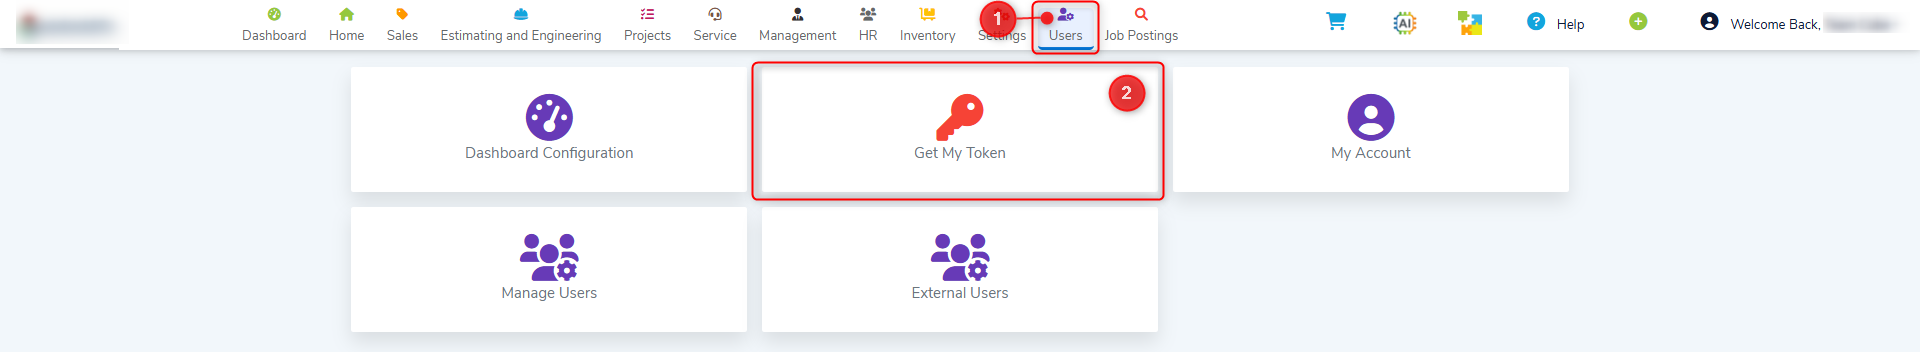
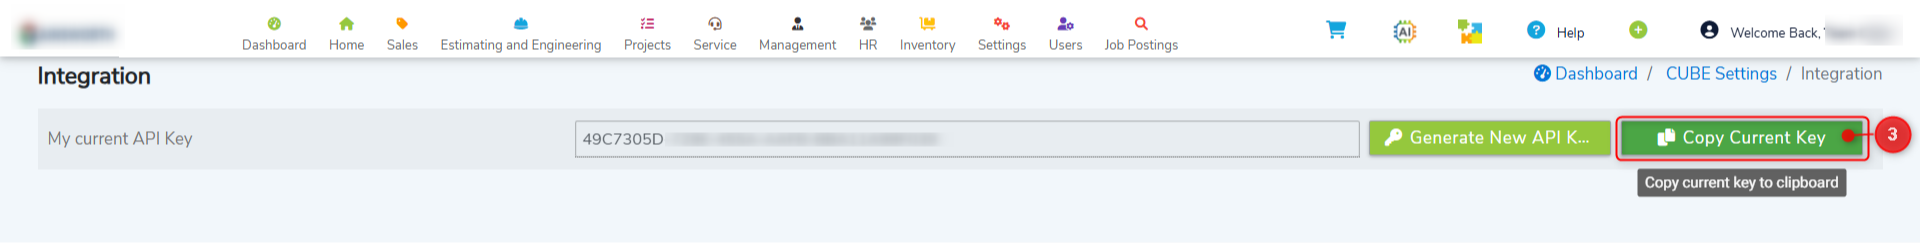
- To obtain the API Key, go to the Users/Get My Token module in CUBE Edge.
- Method: Specify the name of the stored procedure (SP).
4. Json.FromValue(body): Converts the body record into a JSON-formatted binary value.
5. Web.Contents: Sends the HTTP request to the specified url with the provided headers and content.
6. Json.Document(response): Parses the JSON response from the API into a Power BI readable format.
8. After entering the M code, click Done.
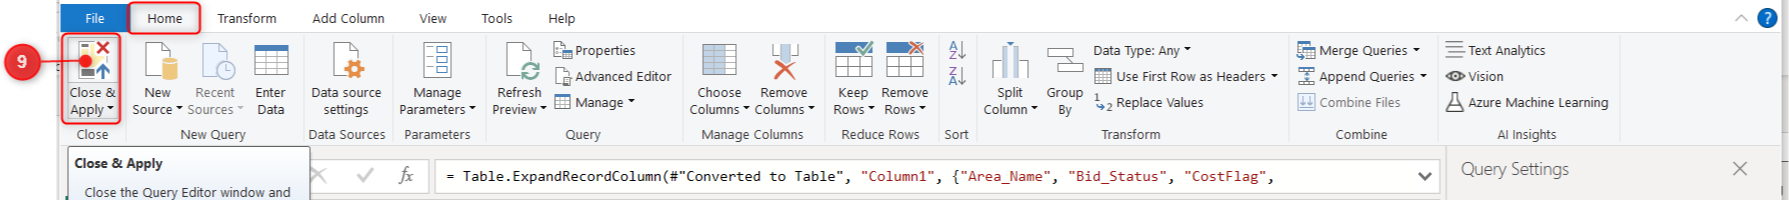
9. In the Power Query Editor, click Close & Apply in the Home tab to execute the query and load the data into your Power BI model.
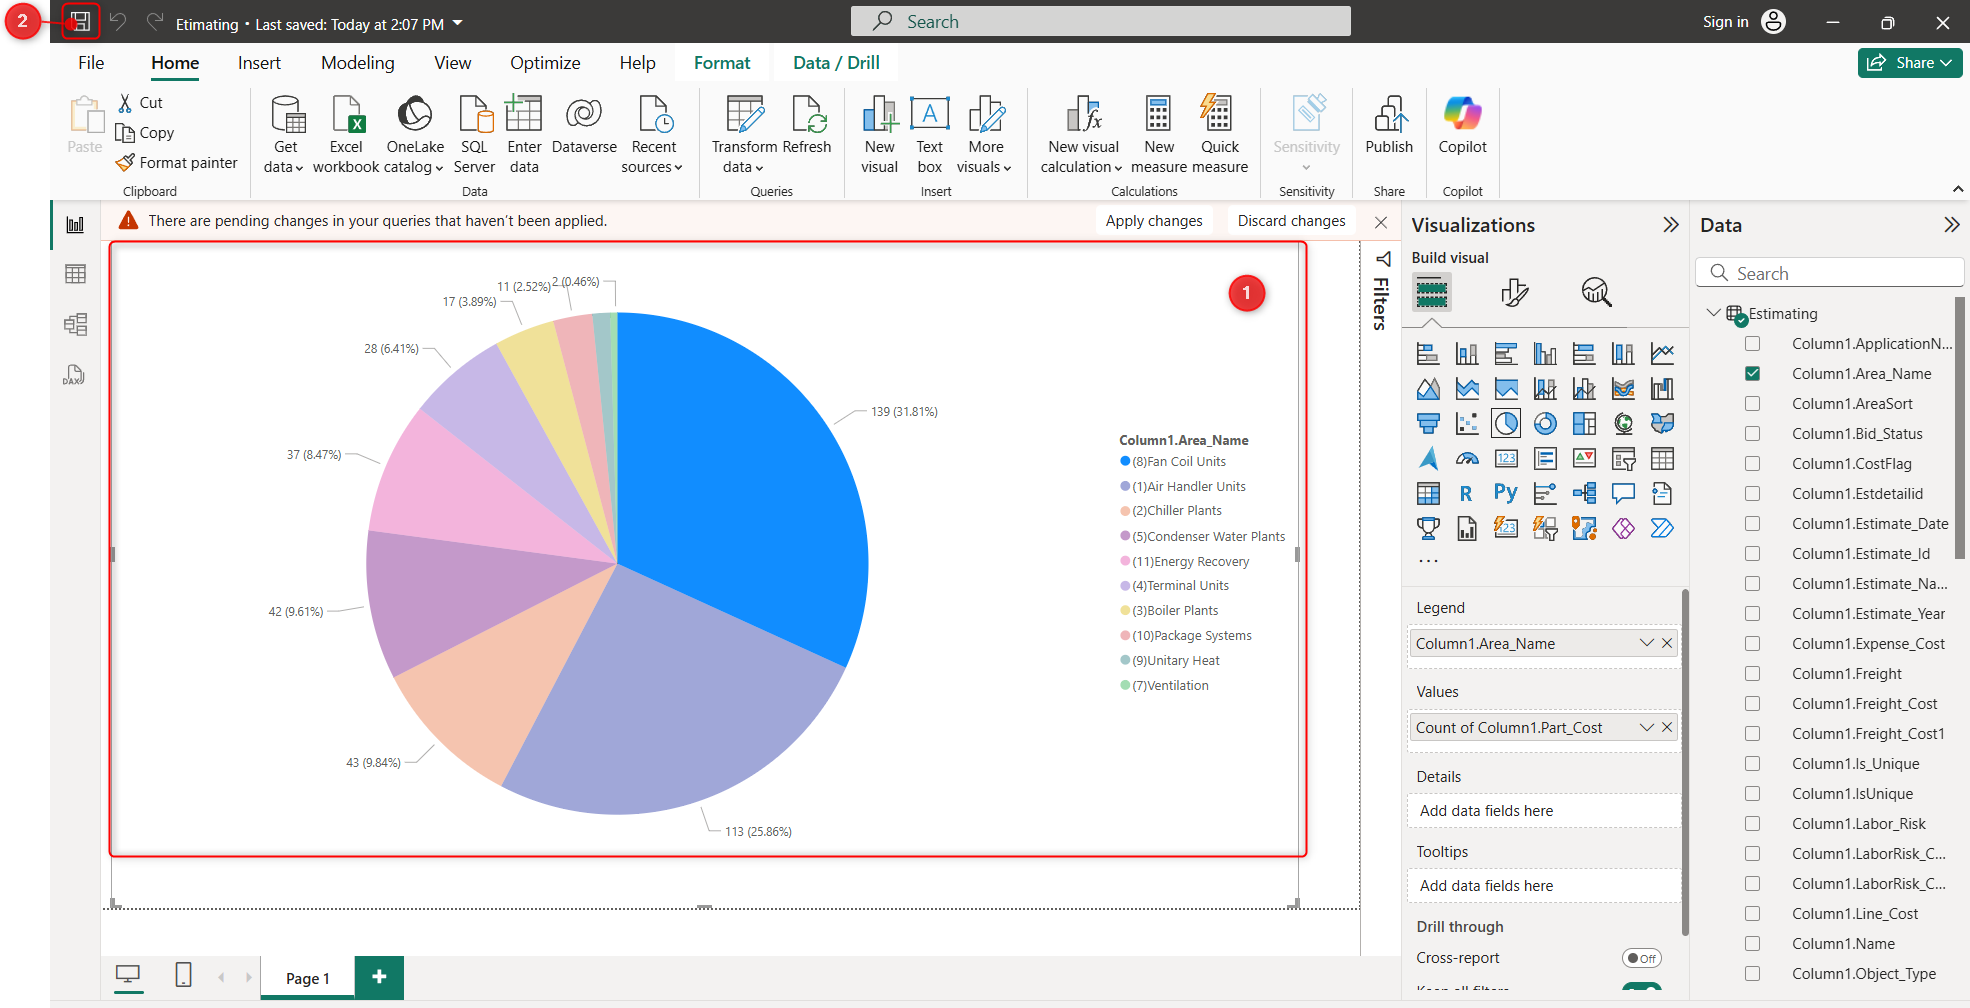
Insert a chart
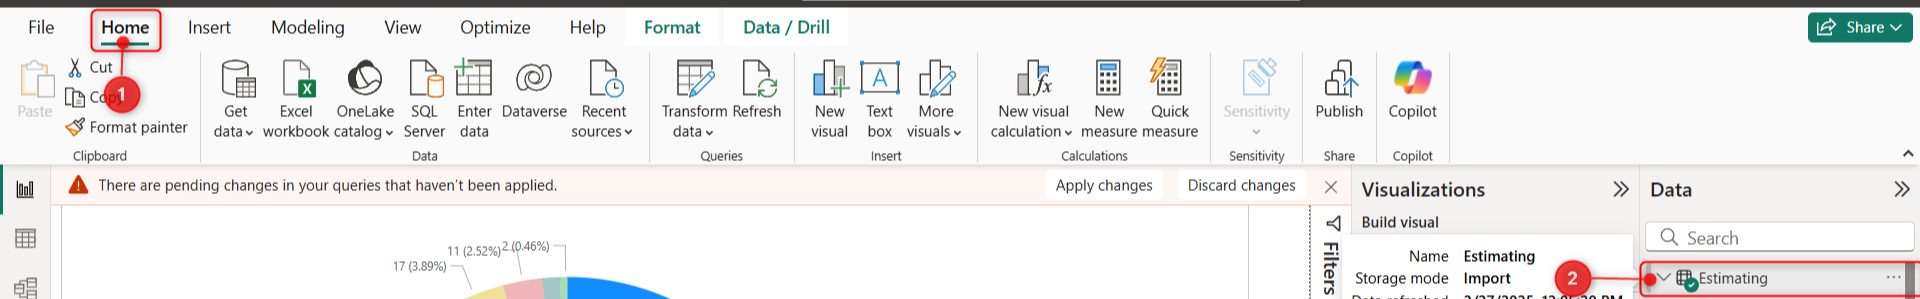
1.Verify the data in the table
After executing the query, go to the Data tab and confirm the query name
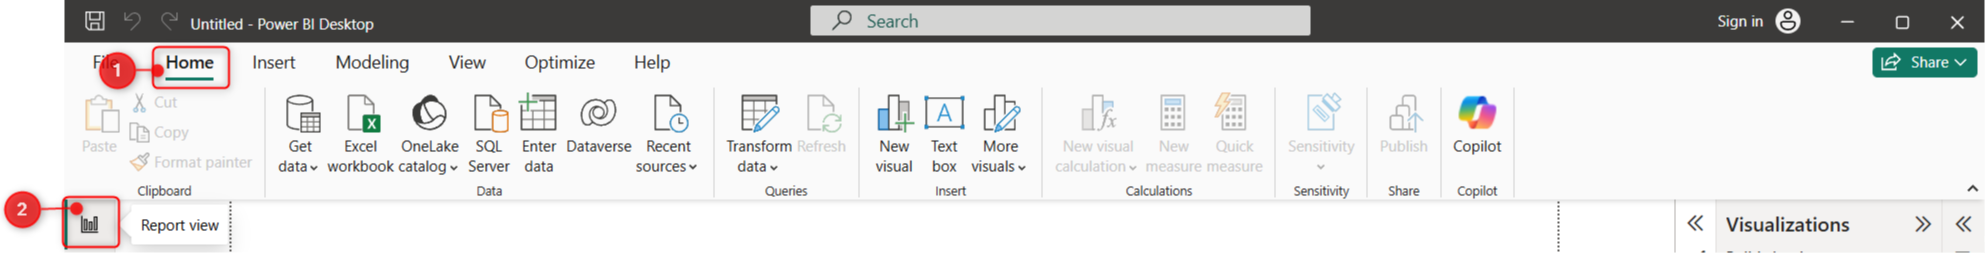
2. Create a visualization in Power BI
Go to the Home tab and click on Report View.
- In the Visualizations panel, select an appropriate chart type, for example, Pie Chart.
- Drag the fields:
- Legend: Area_Name
- Values: Part_Cost

3. Verify that the chart is displayed and press Save.